Bounce-back messages are automated replies from a server that tell the sender that messages could not be delivered to the recipient. There are two types of bounce messages; hard bounces and soft bounces.
If I ever ask a company how they measure success I usually hear opens, clicks, web traffic but very rarely do I hear about measuring the volume of bounces. While it is normal to receive bounces, receiving too many could indicate a wider problem, so measurement of bounce number should be a key metric.
Below are four reasons why you should keep an eye on your bounces:
1. Bounces can let you know when contacts change jobs.
If a contact’s email hard bounces this could mean that they’ve moved jobs. This is a great opportunity to find out who has replaced them or where they have moved to. Especially if this person works for a key client.
2. Suppressing bounced contacts improves your sending reputation.
Continuing to send to contacts that have bounced can have an adverse effect on your sending reputation. We recommend that you set a threshold after which you suppress contacts that have bounced consecutively. We suggest two for hard bouncers and ten for soft bouncers. Suppressing these contacts also keeps your list nice and clean.
3. Bounces can help you identify companies where you are having deliverability issues.
If you see a high number of bounces for a specific company this may highlight deliverability issues with that business. Some bounce messages tell us that the recipient’s server thinks you pose a threat or that you appear to be a spammer.
4. Bounce-rate can highlight general deliverability issues
If you see significant changes to the number of bounces you receive this could highlight a broader problem. Set yourself a baseline or average number of bounces and if you see anything much higher than this then get in touch with us to help.
Where can you check your bounces?
Email send report
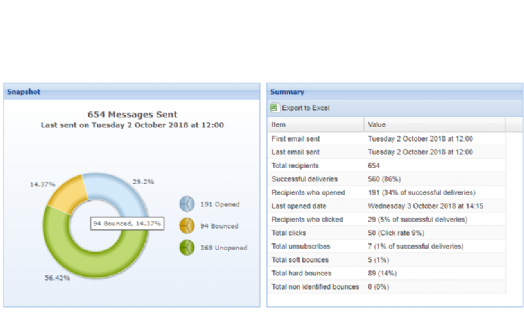
The first place you should look is in the reporting module for your email sends. You’ll see a pie chart on the left as well as percentages that show both hard and soft bouncers. Anything above five per cent total bounces, combining both soft and hard, is worth investigating.
Click on undeliverables to see who bounced in this list. You can export this list if you need to. In the export list you can view the entire bounce message under the column “BouncebackMessage”. Sometimes this can give you a deeper understanding of why the email bounced.

Bounce-back dashboard
The second place you can go is: Dashboards>Bounce Backs
Here you can run the report to look at your bounces in a given period. This will show you how many bounces you receive for each domain.
If you speak to your Account Manager they will break this report down further and see the delivery for your top domains.
Global bounce-back dashboard
You can also go to: Reports>Email>Global Bounce Backs.
This report shows a detail about the bounces you’ve received in a given period.
General system statistics dashboard
The final place you can go to is Dashboards>General System Statistics
You can run the dashboard for the last twelve months and you can see overall undeliverable rates in the column on the far right-hand side.
